
Who this is for
- Plant managers who get OEE from a spreadsheet a week late, or not at all.
- Manufacturing engineers who know a cell is the bottleneck but can't prove why.
- Lines with mixed equipment — old and new PLCs, testers, manual stations — that off-the-shelf OEE software can't read without rework.
What it connects to on the floor
- PLCs — mainly Allen-Bradley; also Beckhoff, Delta, AutomationDirect, PLCnext and CODESYS-based controllers — and other or proprietary controllers are worth a look
- SCADA and test platforms — Ignition and LabVIEW
- End-of-line and functional testers (pass/fail, measured values, serials)
- Barcode scanners and label printers for traceability
- Environmental sensors — the homepage console includes a 1-wire temperature rack
- Your ERP/MES, when counts and part numbers need to flow upstream
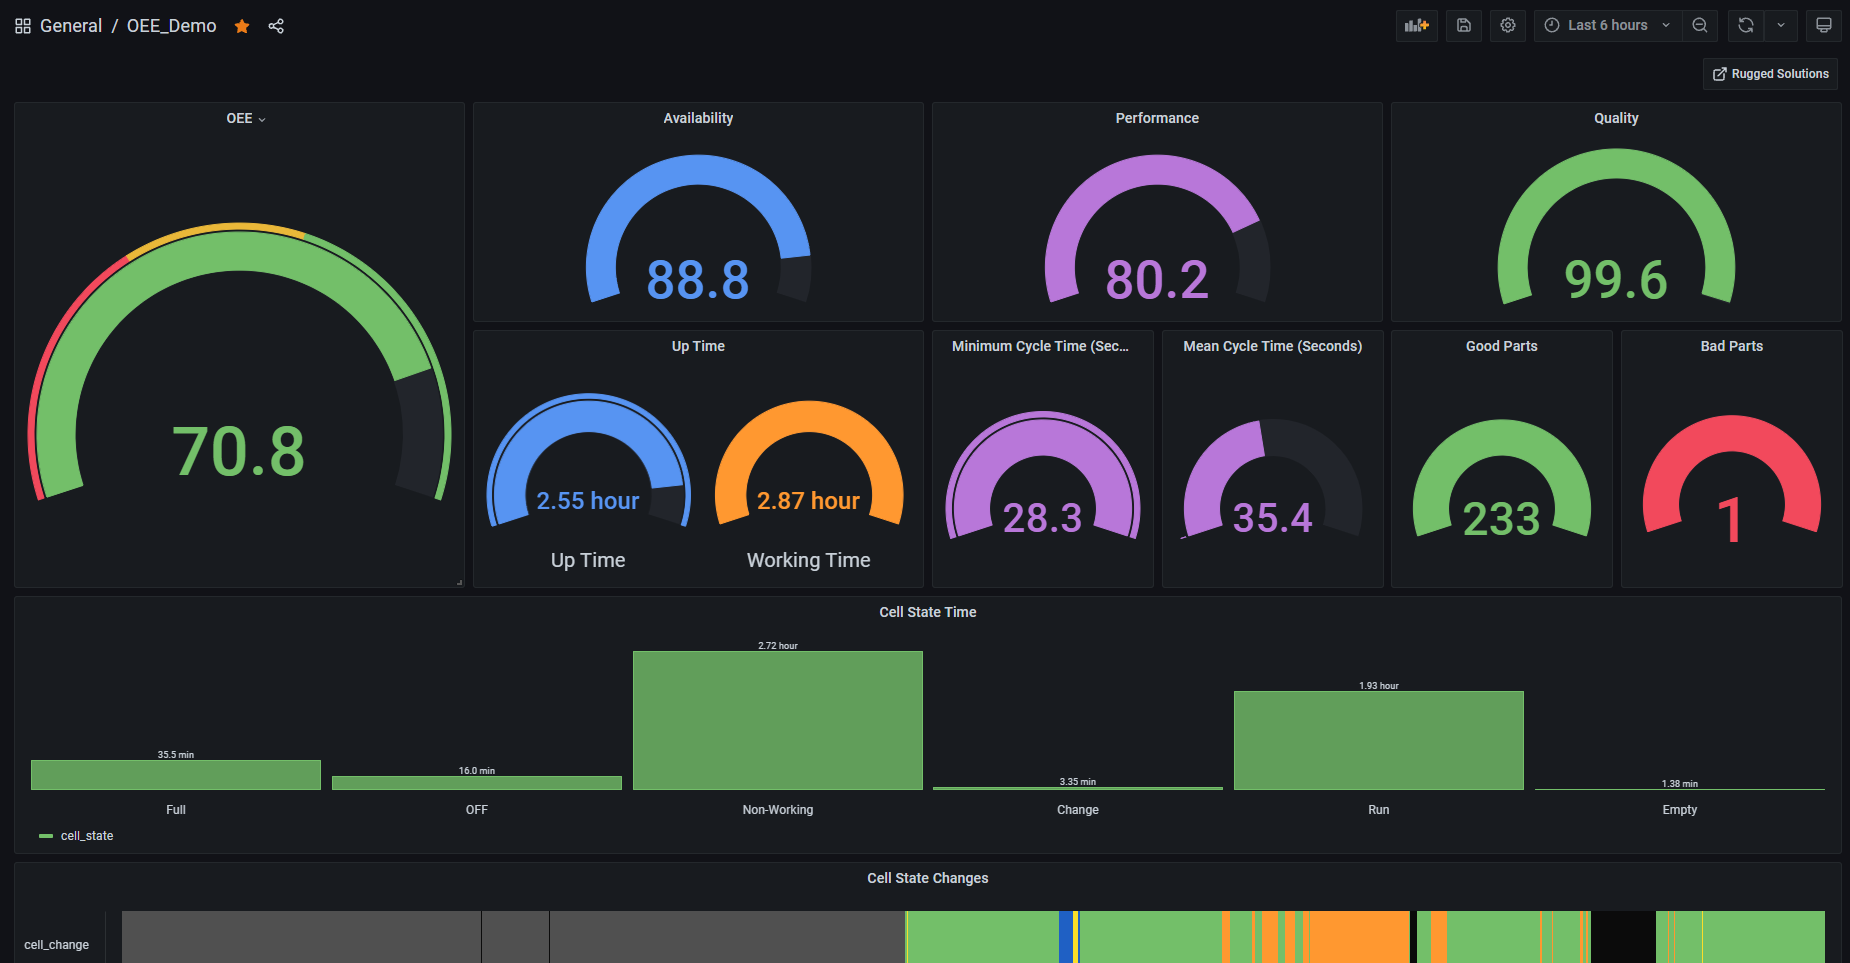
What the dashboards show
OEE per cell
Availability, performance and quality, trailing 2 h, shift, day and week — the same A × P × Q gauges running on our homepage.
State timeline
Every run, fault, changeover, starved and blocked interval on one timeline, so “why were we down at 2 pm” has an answer.
Downtime by cause
Ranked fault and changeover time per cell, so the next improvement goes where it pays.
Condition alerting
Text, email or your platform of choice when a cell faults, slows or drifts out of spec.
Single pane of glass
Plant-wide view for the office and the floor, on the screens you already have.
Your data, your servers
On-prem or cloud; built to be maintained for decades, not a subscription you can't leave.
How a project runs
1. Analysis. On-site review of the line, the signals available, and what “good” means for you.
2. Acquisition. We capture machine states and counts, validate them against the floor, and start recording.
3. Action. Dashboards, reports and alerts go live; we tune them with your supervisors.
Typical pilot: one line in 2–4 weeks.
See it before you talk to us: our homepage is an OEE console.
Open the live consoleResults clients measured
“After Rugged Solutions rewrote our OEM machine software, we increased output by 90% … the machine's speed now makes the rest of the line the bottleneck.”